Ryan Russo on DOT’s “Mobility Report” and the Need for Better Bus Service

DOT's "New York City Mobility Report" [PDF], released earlier this week, is the agency's first overview of NYC transportation trends in three years. As the number of people and jobs in the city has grown prodigiously in the past five years, DOT reports, the subway system and, increasingly, the bike network have allowed more New Yorkers to get where they need to go. But there are signs of strain -- bus ridership is declining and bus speeds are slowing, and traffic congestion in the Manhattan core is rising.
Streetsblog spoke with DOT Deputy Commissioner for Transportation Management & Planning Ryan Russo, who oversees the agency's long-term strategy and the projects that bring that strategy to fruition, about the report and its implications.

Russo told us what he sees as the big takeaways from the report, why it lends more urgency to the agency's efforts to improve bus service and bicycling, and how DOT is applying the information it contains. The interview has been lightly edited for clarity.
What are the key themes that come out in this report? Were any of the findings surprising or unexpected?
We think of New York as a built-out place, right? I don’t think people think of it as changing so quickly. And just this half-a-decade is kind of astounding in terms of 500,000 new jobs. You know, many states don’t even have 500,000 jobs, and those are our new jobs. You know, 370,000 new people. And the number of new tourists we have are all the tourists who go to the city of New Orleans in a year.
So that jumped out, that this city’s changed a lot. While we did have the slow down on the streets, all of those new residents, new jobs, new tourists, they all have to move around the city. We did it really on the backs of some wise decisions we made recently, but also decisions that were made a generation ago to reinvest in the transit system.
The subway system has clearly been the workhorse here in serving that growth. We think we’ve been smart and wise in terms of emphasizing the pedestrian environment which helps support transit, building out a bike network, adding bike-share, trying to keep buses moving with the Select Bus Service program and our partnership with New York City Transit. We think DOT has been a pretty big part of this, but it’s really kind of an amazing story that we did all this growth without -- you know, we didn’t develop on greenfields in the suburbs, we didn’t build a boatload of parking, and we didn’t add a lot of traffic trips particularly in the core.
I think that’s really the main theme there, but there are these harbingers or challenges that this frames. We all know that the subway system is pretty strapped. And seeing the data now -- seeing bus ridership going down, seeing congestion go up -- we’re starting to become victims of the success, so we all have to decide together how we’re going to keep this going.
What differentiates this report from past DOT reports on mobility issues, such as the "Sustainable Streets Index" of the Bloomberg years?
We wanted to build on past reports, but get away from the year-over-year, one percent change, two percent change, watching the leaves grow aspect, and step back and see the entire forest, and if possible tell an extremely long-term story as well as the last five years -- to give people a long view and a short view. That was goal one: that people would understand where we’ve been and where we’re going and understand the challenges going forward.
"We’ve been leaning in on the SBS program, but I think the message to us, now that we look at the data itself, is that we have to lean in even further."
The second shift was that in a transportation report, we used to always sort of put the jobs, the economy, or the population, or the tourists as qualitative context, and it wasn’t an equal in the quantitative treatment. You know, transportation -- as much as we love it, it’s not an end in and of itself. We’re serving other goals of the city: to be vibrant, to offer its residents quality of life, and so on. So we thought it would be good to put those things side-by-side on equal footing -- to actually put population data towards data in the bucket of indicators.
The third change is the combination of new data and old data. We pioneered using the taxi GPS data as a probe of traffic speeds many years ago, but we’ve had Citi Bike up and running for a couple of years now. The nature of a Citi Bike trip in the core is very similar to the nature of a taxi trip in the core, so we went and we cordoned off a geography and analyzed taxi and Citi Bike trips and put that data side-by-side. Those are maybe existing data sources that people had, but a new way of looking at it. MTA Bus Time had also not been summarized in one of our reports before, so in essence this is sort of the “sweet sixteen” of MTA Bus Time for us. I know there’s people out there starting to take advantage of it and developing third-party apps and stuff, but we also need to take advantage of this tool and use it and make sure we’re learning from it and incorporating it.
It seems counterintuitive that while fewer vehicles are entering the city core, traffic speeds have slowed. Do you have theories as to why?
I don’t want to get too much into causality there because that’s not an easy thing to prove and everybody’s getting into the speculation business, but this is what happens when economic activity goes up. It might be more deliveries to a store, it might be more construction activity -- which we do our best to minimize the impact. It’s all those things working together. You know, the business district with the fastest speeds is downtown Detroit, so activity kind of generates this naturally.
"We’d like to see people start seeing Citi Bike and the bike network on their mental map so that they’re saving time, saving money, and we’re moving people as efficiently as possible."
If you look at the long-term trends, and we put these eras in there: 1920 to 1950, 1950 to 1980. You know, an era of rapid growth in driving -- the 1950 to 1980 era -- coincided with an era where overall city population declined. The regional growth was concentrated in the suburbs and employment in the city declined. So we had vehicle registration going up, we had river crossings going up into Manhattan, but we had subway ridership going down and the population and employment going down. In the next period, the 1980 to 2010 period, those trends basically get flipped.
I think that’s important for people to understand that our most vibrant eras -- that vibrancy has really been on the backs of mass transit.
How should that shift towards transit inform NYC DOT’s work in the coming years?
On the big picture, it’s important to note that collectively there’s a lot of different players making the policy decisions. We’re just one of many transportation agencies, but the city as a whole -- whether it’s the ballot box or letters to electeds -- we’re all going to chart our course together. Our hope is that this information in a digestible manner that’s also insightful helps all the different players make wise choices as we go forward.
In terms of us specifically, I think of the role of bike-share, for example, in solving these mobility problems. We started running these kinds of analyses a little bit ago, and I think it helped us be comfortable with the potential of the Amsterdam Avenue protected bike lane, for example, because we looked at short trips. Even on the Upper West Side there’s a lot of short taxi trips, so it helps us get more comfortable -- in seeing the popularity of Citi Bike, how affordable and how fast a Citi Bike trip can be in comparison to a taxi trip -- with making decisions about bike infrastructure in particular locations or particular places.
The report highlights a years-old trend of declining bus speeds and bus ridership. How has the new Bus Time data in this report enabled DOT to understand the issue of bus speeds better?
Bus Time allows you to find where on a route the bus is slowest, so you don’t necessarily have to figure out how to do a bus lane on an entire route if everything is going well but there’s just a couple of spots where the bus gets hung up.
There’s a lot of things that can impact bus running time. Our role as the street manager is very important, but so is New York City Transit’s role as dispatcher and operator -- there’s a lot of things that affect reliability there.
We have to work harder with our partners at the MTA. Building new underground rights of way is a long-term prospect, and while they’ll always be more efficient than a surface right of way, we’ve got to get what we can out of it and it’s troubling to see bus ridership declining.
We’ve been leaning in on the SBS program, but I think the message to us, now that we look at the data itself, is that we have to lean in even further.
The bus times can help us reveal specific "hotspots" where buses are slower. We have a project up at 96th and 97th Street that we’re doing right now to help the crosstown M96 get through a hotspot. It’s not a full Select Bus Service project, but addresses a specific place where the bus is getting chronically stuck, which then ripples through the entire route and affects people on the entire route.

If this report starts the conversation around the bus, we’ll be happy about that. I jokingly refer to the bus as our transit’s middle child. Because there’s a bigger child in the subway system that is really important and has its challenges and attracts a lot of bandwidth from everyone. But you know, the subway is six million trips a day -- the middle child is two and half million trips a day, so this is a really important mode. The youngest child might be some of the newer things we’re thinking about, but I think we’ll consider this report a success if we brought some attention to the middle child.
One of the important points the report highlights is that it’s faster to travel in the Midtown core by bike than it is by taxi. Why is that significant from a transportation planning perspective?
People are making choices every day. People sometimes don’t realize that their city has changed. We talked about that dramatic change that happened kind of under our noses with 500,000 jobs. One of the things that’s changed is we’ve implemented Citi Bike and we’ve been building a bike network with it. So people might be making, in essence, market decisions with imperfect information.
Of course every trip choice has its own details and nuances. You might be coming out of a store with lots of shopping bags, you might be getting out of Penn Station with a ton of luggage, you might be late for a meeting. Whatever it is, each individual trip has its own reasons, and we don’t begrudge people for choosing what they choose, but if they had better information -- that for many of these trips that are incredibly short, people chose Citi Bike -- I think that’d be helpful for all the people who remain in the taxis, who remain on the buses, [and] who are walking on the streets. When we look at the amount of taxi trips in the Midtown core, when you’re talking 1,500 trips every hour that start or end in that little box, you know, driving the distance from New York to Miami every hour, that’s a lot of trips that, from that physics perspective, if folks would say, “Well you know I think I could walk this trip, or maybe the bus is coming down the street, or I could Citi Bike this,” we could deliver a lot of benefit to our growing core.

Putting this back to the context of a changing city, we’ve seen a lot of development on our waterfront, on the far West Side -- in places that maybe aren’t right over a subway station. And I think Citi Bike and the bike network have made those places livable because someone is comfortable incorporating bikes into their routines one way or another. It’s not for everyone and every trip, but I think Citi Bike has made a lot of the change in the city work for people in a better way and I think we need to support that -- to pay attention to the growth, to integrate cycling into our subway. I think we can make a subway trip more reliable if someone can just bike a little bit further to the line that makes them have a one-seat ride on the subway system as opposed to relying on a transfer. We’d like to see people start seeing Citi Bike and the bike network on their mental map to help make those most efficient choices, so that they’re saving time, saving money and that we’re moving people as efficiently as possible.
This report is a reminder that our success has come because of wise decisions made to invest in mass transit, which has supported the dynamism of the city. As we take a snapshot as to where we are now, we need to remember that lesson as we figure out what we’re going to do, and how we’re going to invest going forward.
Stay in touch
Sign up for our free newsletter
More from Streetsblog New York City
Tuesday’s Headlines: Valley of Political Death Edition
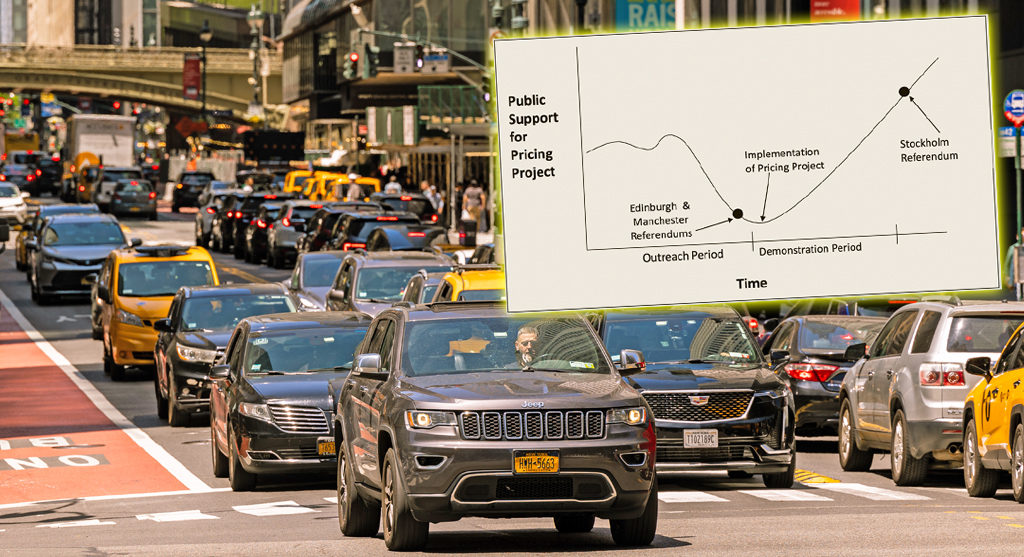
Did you see the new poll showing congestion pricing is really unpopular? Ignore it! Good times are coming. Plus other news in today's headlines.
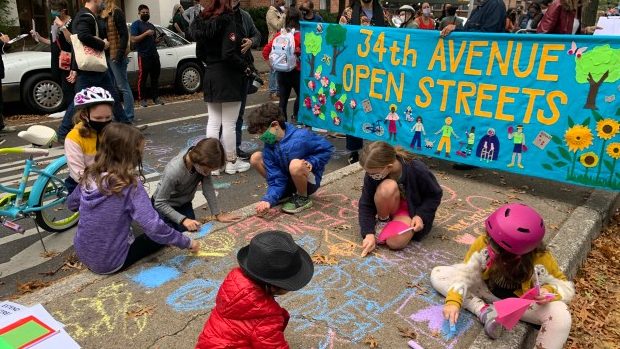
Open Streets Groups Warn of Extra Red Tape to Run Events
Two weeks notice for hopscotch or a yoga class?
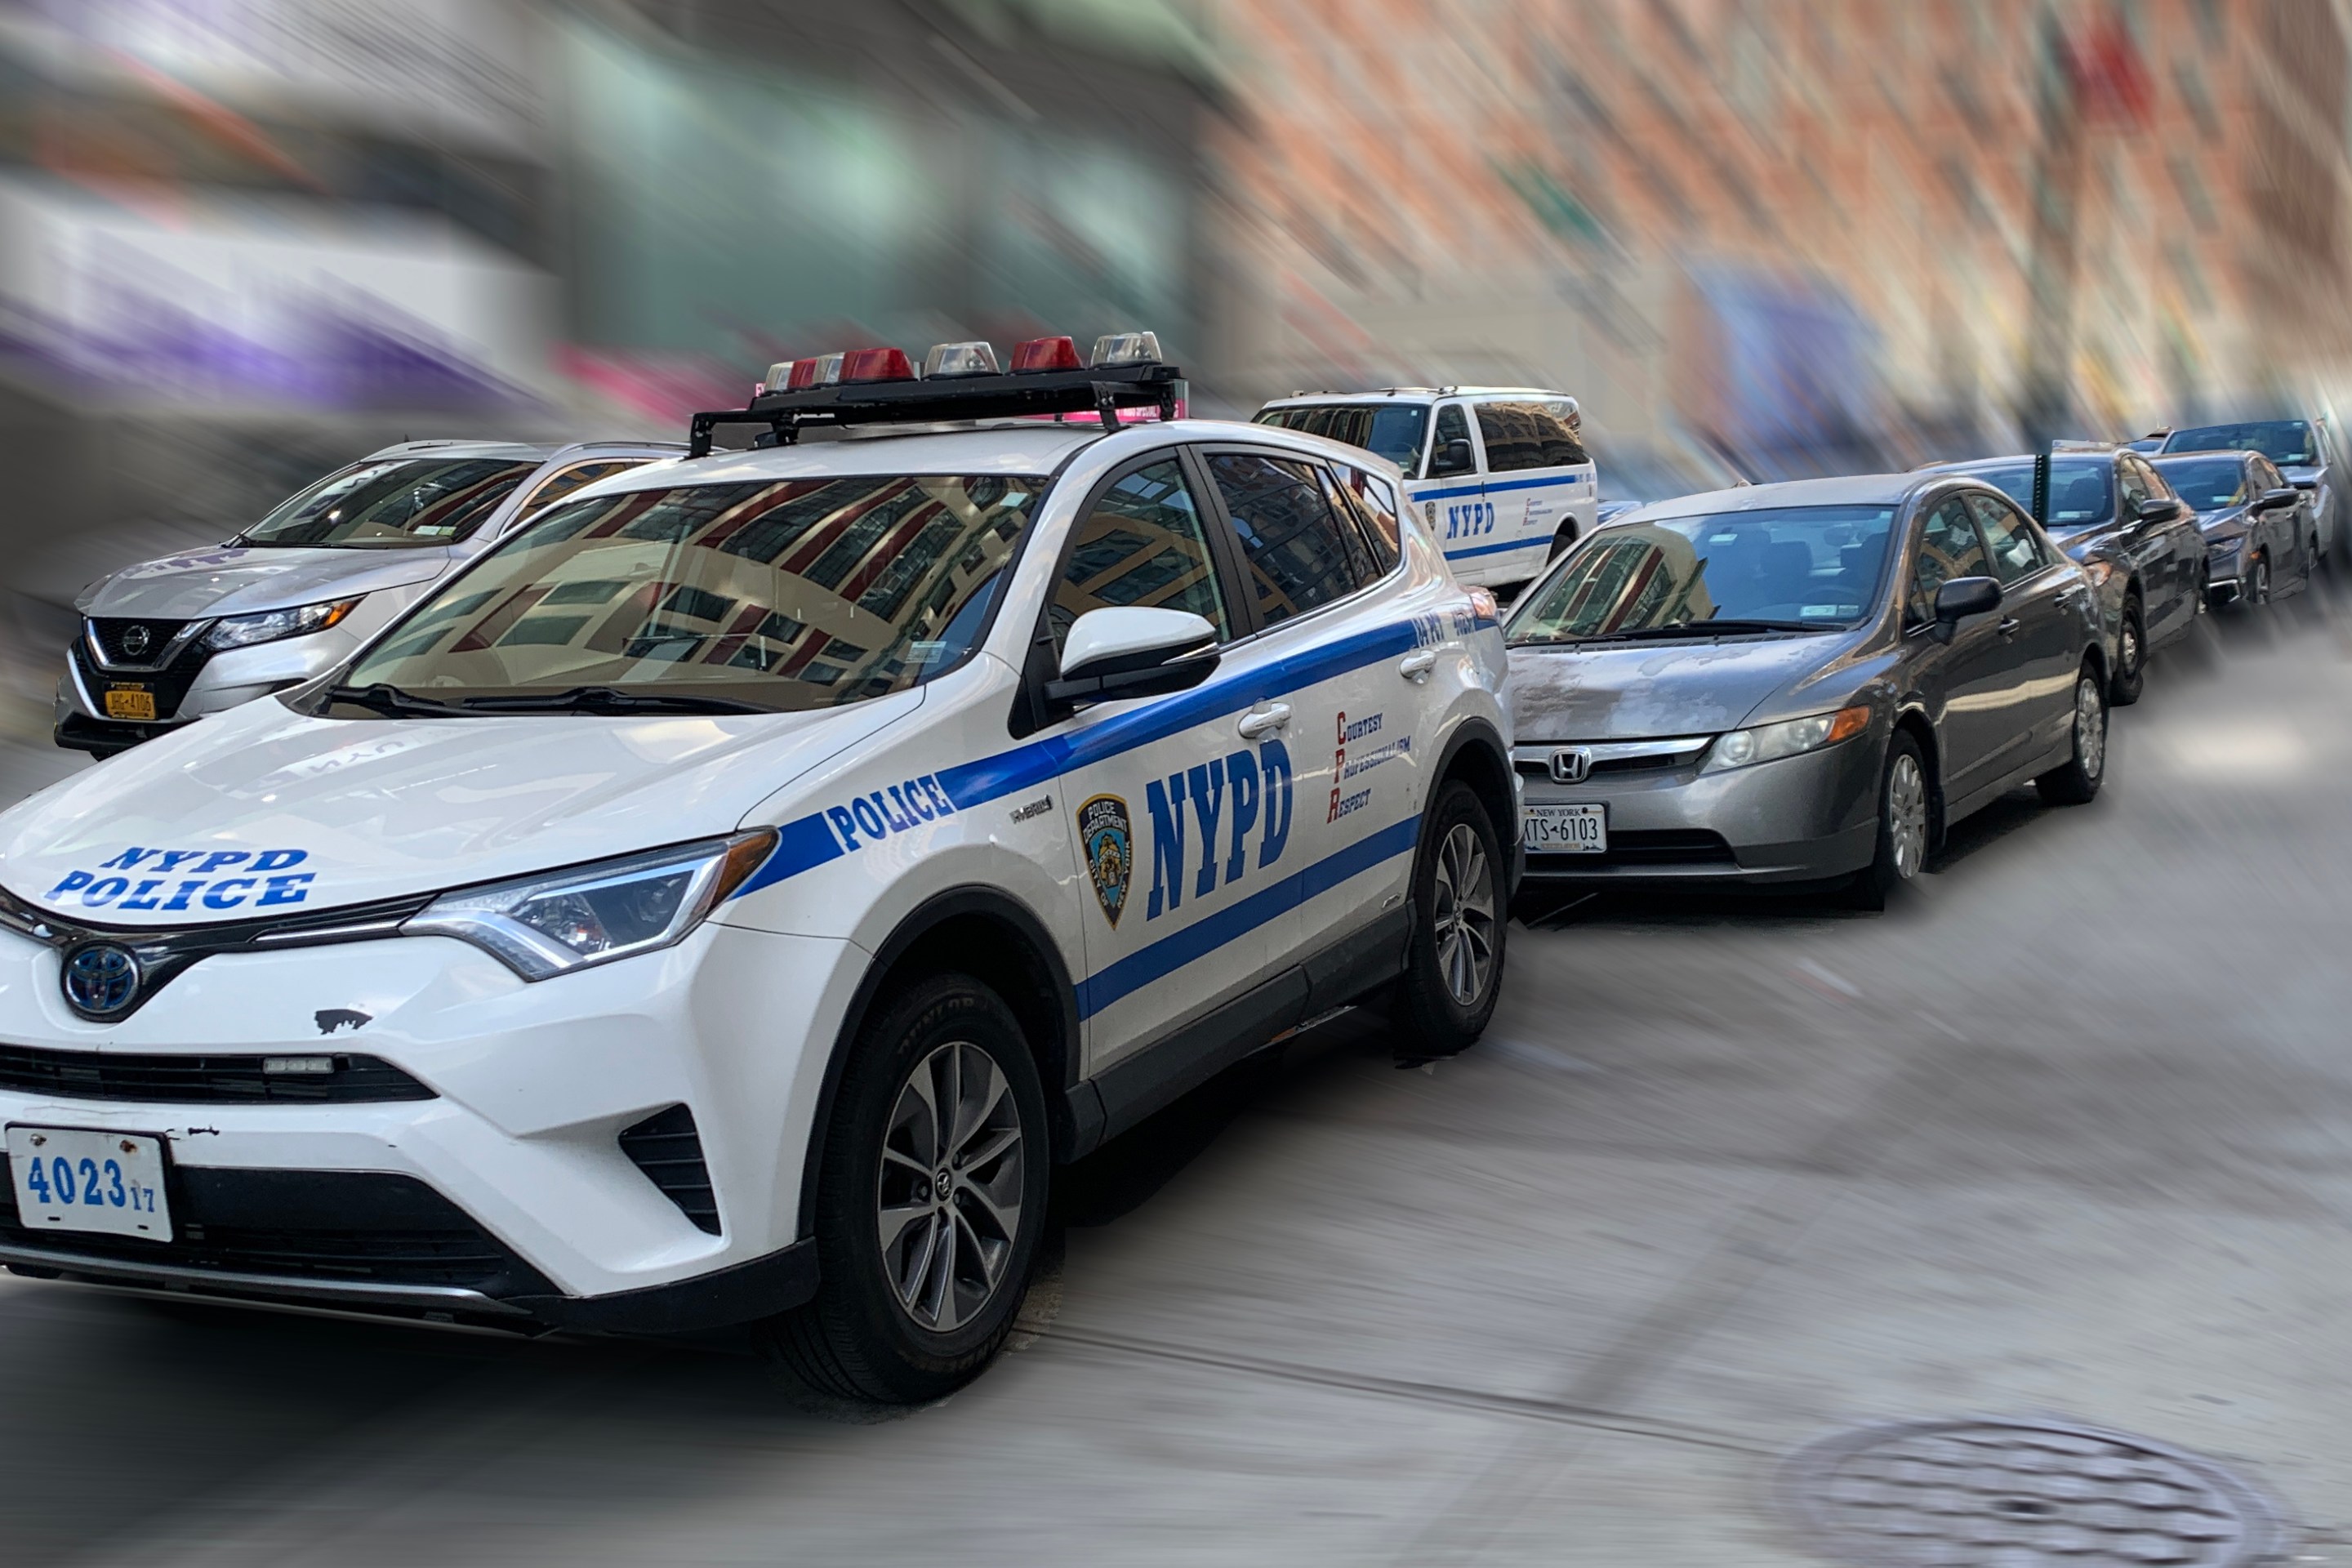
Monday’s Headlines: A Federal Case over Parking Edition
We're flicking our bicycle bell over a big scoop last week that no one picked up on...yet. Plus other news.
Hochul, Legislators Reach Toll Evasion Crackdown Deal
Higher fines for covering a plate and for not paying tolls are part of the budget deal inked on Saturday.
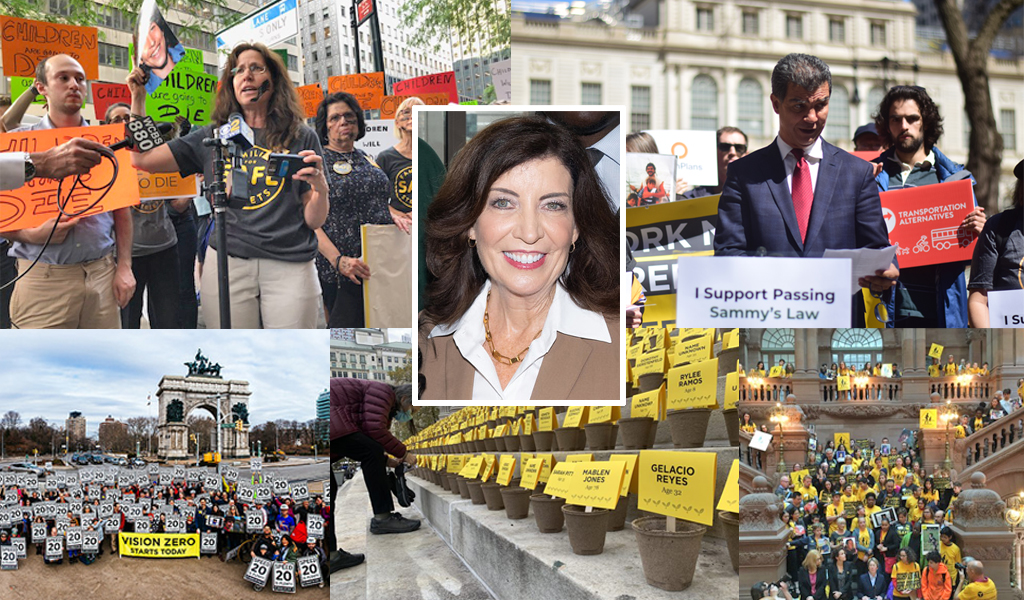
Behind the Scenes: How Gov. Hochul Got ‘Sammy’s Law’ Over the Finish Line
Opponents didn't want to put their name on a no vote for the life-saving measure.