Why Traffic Congestion Has Rebounded in the CBD
Traffic congestion in the Manhattan core is rebounding. Travel-speed data culled from taxicab GPS and released last month by City transportation and taxi officials suggest that average motor vehicle travel speeds in the Central Business District fell by 8.5 percent from 2012 to 2014. The slowdown follows years of flat or even rising speeds -- a phenomenon that predated the 2008 financial collapse and undermined congestion pricing proposals by making car, bus, truck and taxi travel in the heart of the city a little more efficient and predictable.
The speed data were issued during the recent Uber controversy, but they bear on a host of other policy issues including Vision Zero, cycle infrastructure, and bus priority signals and lanes. To inject some rigor into these discussions, I’ve created a special section of my Balanced Transportation Analyzer spreadsheet to approximate various factors’ roles in re-congesting the CBD. My preliminary findings are summarized in the graphic. (Readers interested in a deep dive should download the BTA and navigate to the new tab, CBD Congestion.)

The task is to account for an “adjusted” 10.5 percent drop in CBD travel speeds. That figure tacks 2 percentage points on top of the observed 8.5 percent reduction to reflect the fact that the 20,000 a day decrease in motor vehicle entries from 2012 to 2014 also reported by DOT should have increased CBD travel speeds by 2.0 percent. Here are details:
- Uber: My calculation that the presence of Uber vehicles in the CBD is reducing travel speeds by 4.3 percent, is predicated on 50 percent additionality, with half of Uber CBD pick-ups constituting additional traffic while the other half displace yellow cabs and traditional black car service. (Additionality is almost certainly higher for Uber trips outside the CBD, where yellow cabs are far less prevalent.) I previously published a higher estimate of Uber’s impact, but that was predicated on 75 percent additionality. The 50 percent rate used here is based on data-mining by the New York Times, published yesterday in its “Upshot” column.
- CBD Cycle Infrastructure: Bicycle lanes draw some mode share from taxis and app-based for-hire vehicles, and they arguably make traffic flow more orderly, but on balance the space they take from motor vehicle use probably outweighs those effects. I estimate that CBD bike lanes added from 2012 to 2014 effectively removed eight-tenths of one percent of available CBD street space, which, by my modeling, would have led to a 1.9 percent average slowdown in motor traffic.
- Cheaper Gasoline: Pump prices have fallen around a dollar a gallon since last fall, cutting an estimated 6 percent from the cost of a typical automobile round-trip to the CBD, which my modeling suggests would lead to 3 percent more trips, or 20,000 additional CBD auto trips a day. (Note that this increase, like the others reported here, is a net figure that assumes that incremental gridlock causes some other auto trips to disappear.) While this rise would postdate the latest official figures on CBD vehicle entries, I’m betting it will be reflected in a modest uptick in 2015 data. The associated reduction in CBD speeds is 2.0 percent, according to the BTA.
- Pedestrian Traffic and Vision Zero: Three possible phenomena intersect here: more people on foot in the CBD, greater tendency of turning drivers to wait for pedestrians to clear crosswalks, and the 2014 local law reducing the speed limit on NYC streets to 25 mph (from 30 mph). I give credence to the first two categories and have assigned them modest vehicle speed reductions, 0.5 percent each. But I grant only a de minimis 0.1 percent effect to the third, based on the infrequency of opportunities to reach 30 mph in the CBD as well as lackadaisical NYPD enforcement of the new lower limit.
Summing up, my half-dozen factors account for 9.3 percent of the adjusted observed 10.5 percent drop in CBD travel speeds. The remainder could be due to Uber (I may have lowballed the traffic impact of their deadheading vehicles), or the advent of other app-based FHV’s such as Lyft, or errors in any of my component estimates. This is not an exact science, and my decimal-point figures are only meant to convey central estimates and not to imply precision.
What’s the bottom line? Clarity, I hope. Public policy works better when it’s built on informed analysis. Still, parsing the resurgence in traffic congestion isn’t nearly as vital as recognizing and responding to it as the calamity it is. There’s still one proposal out there for alleviating CBD gridlock that can also finance the new wave of transit upgrades and reform the city’s inequitable tolling system. And, unlike the 2007-08 congestion pricing proposal, there’s just one man standing in the way.
Stay in touch
Sign up for our free newsletter
More from Streetsblog New York City
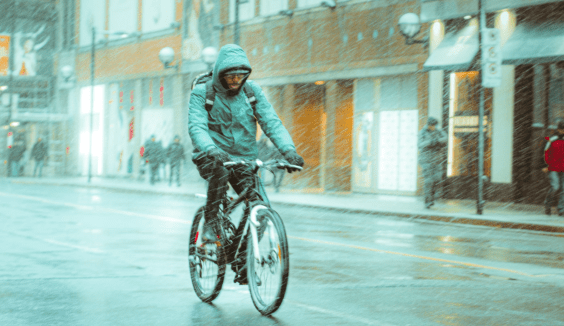
What to Say When Someone Claims ‘No One Bikes or Walks in Bad Weather’
Yes, sustainable modes are more vulnerable to bad weather. But that's why we should invest more in them — not less.
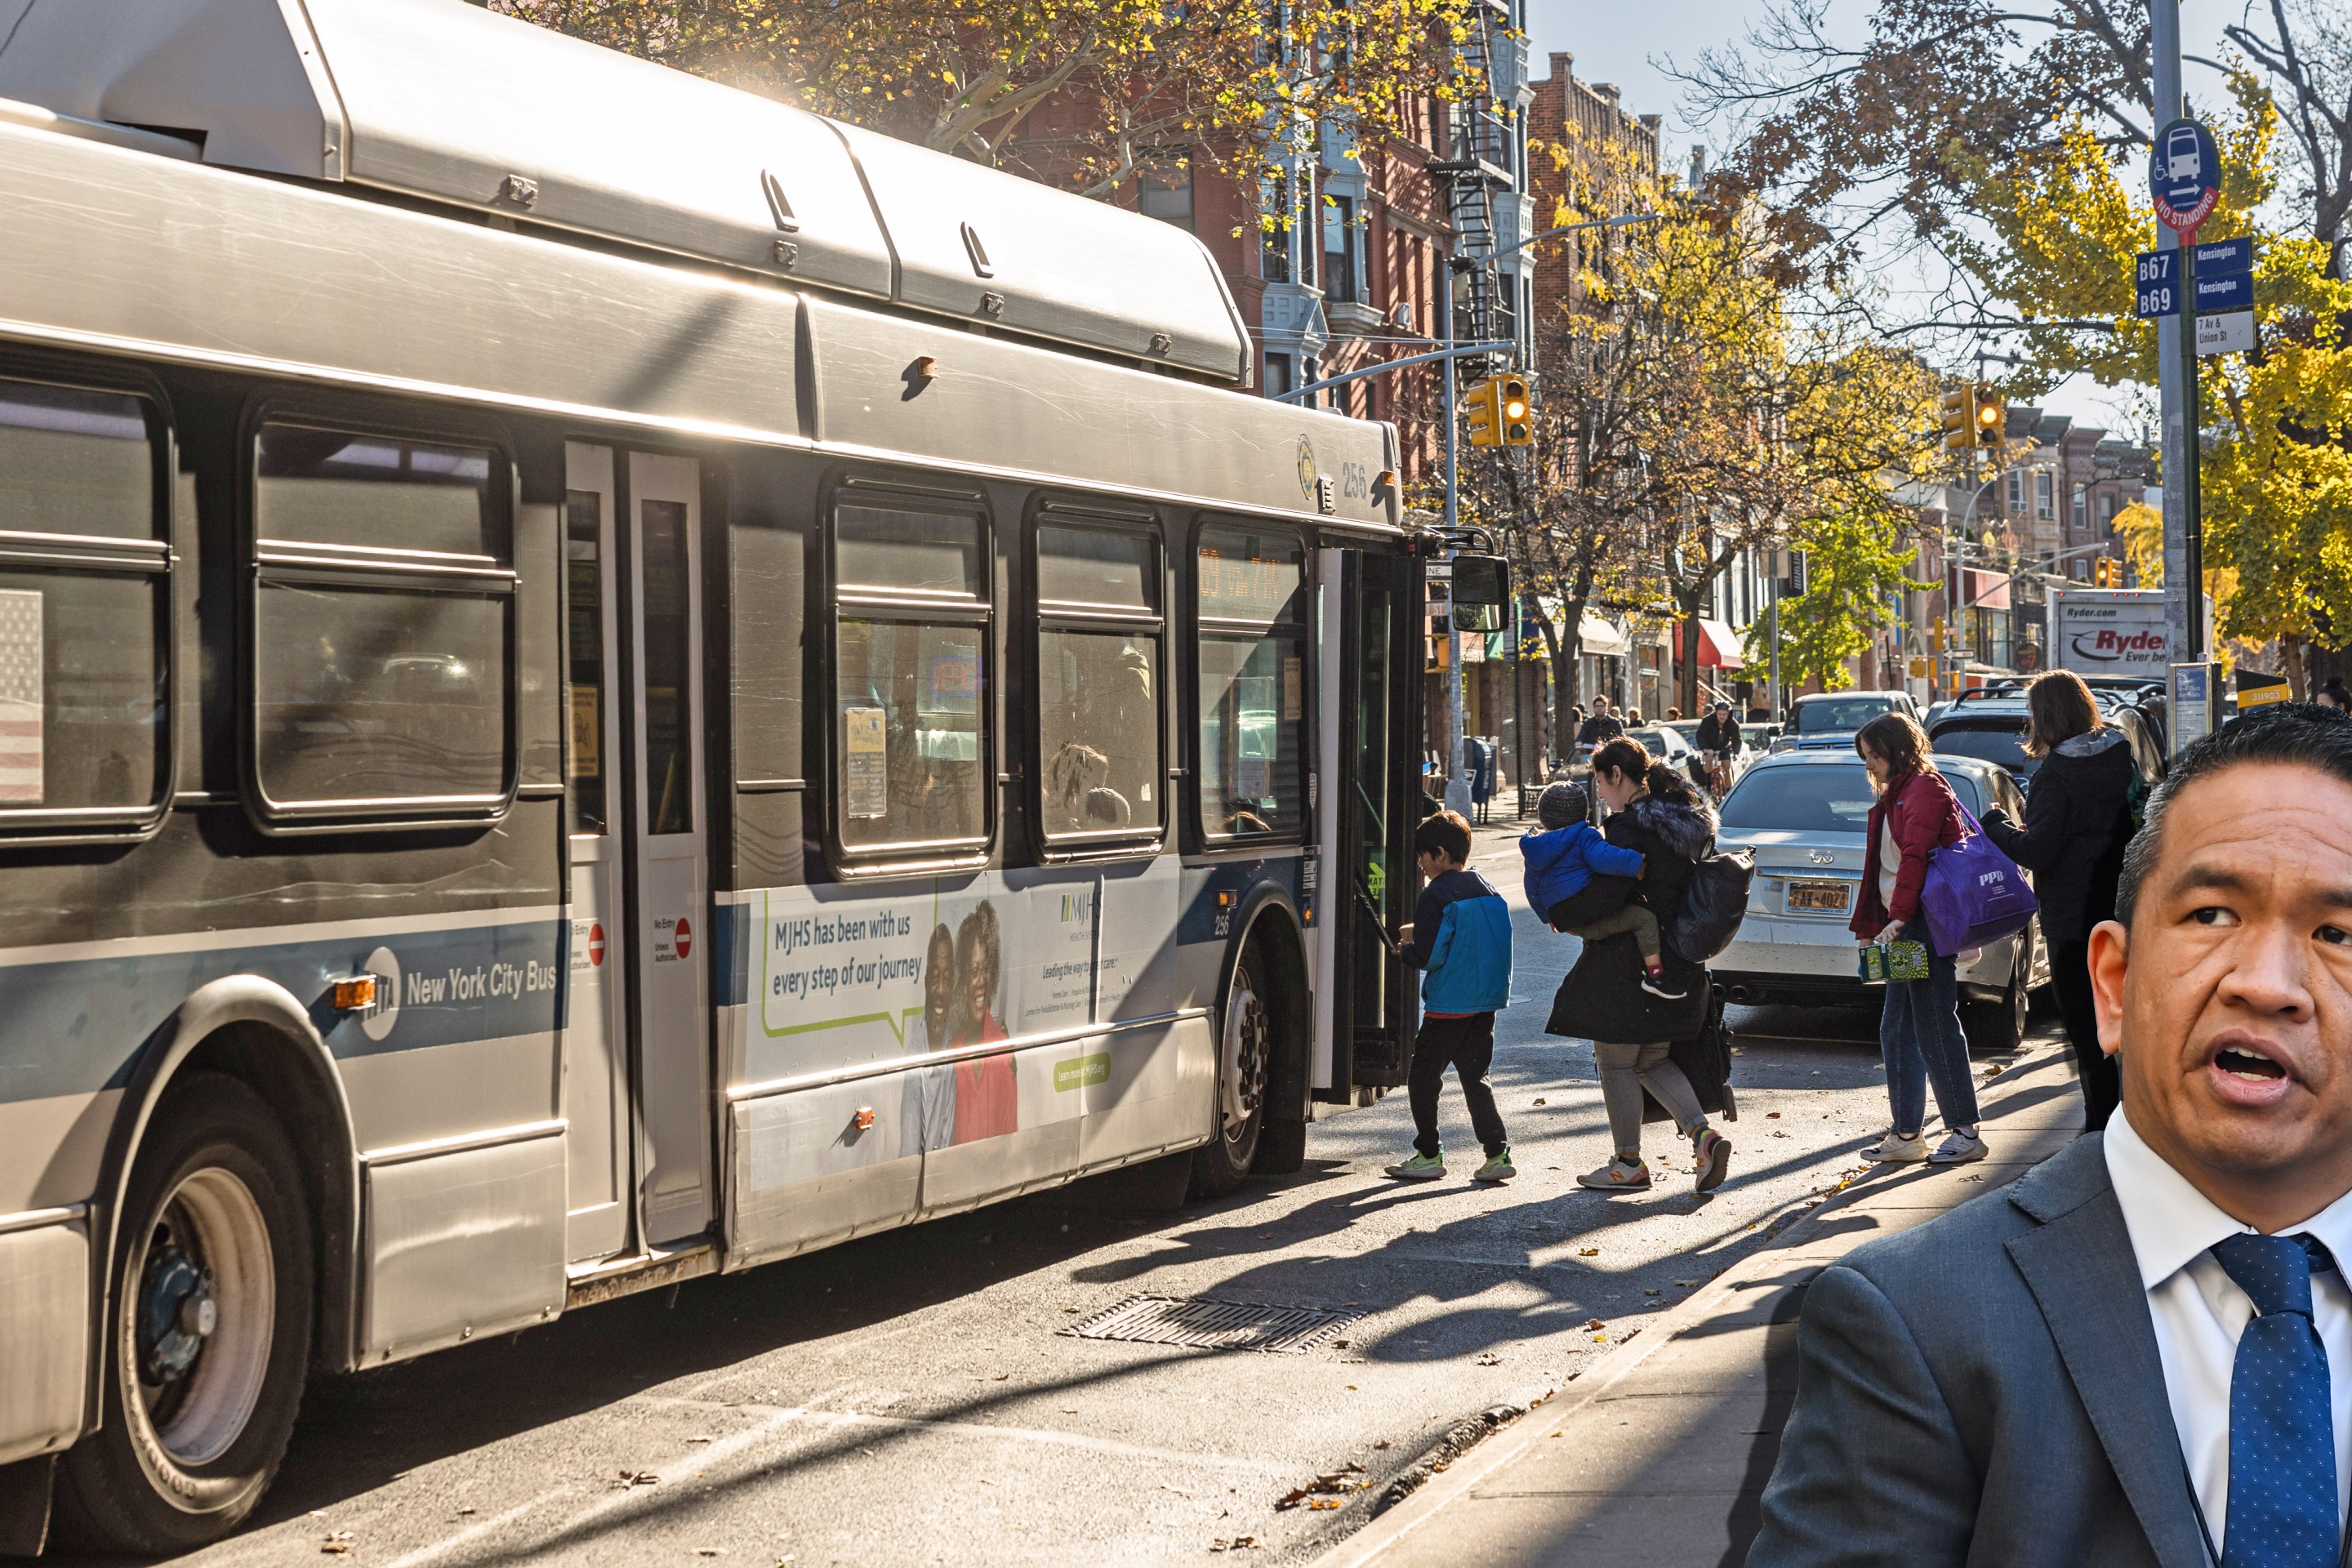
NYC Transit’s New Operations Chief Wants To Fight ‘Ghost Buses’
One-time transit advocate and current MTA Paratransit VP Chris Pangilinan will oversee bus and subway operations for the whole city.
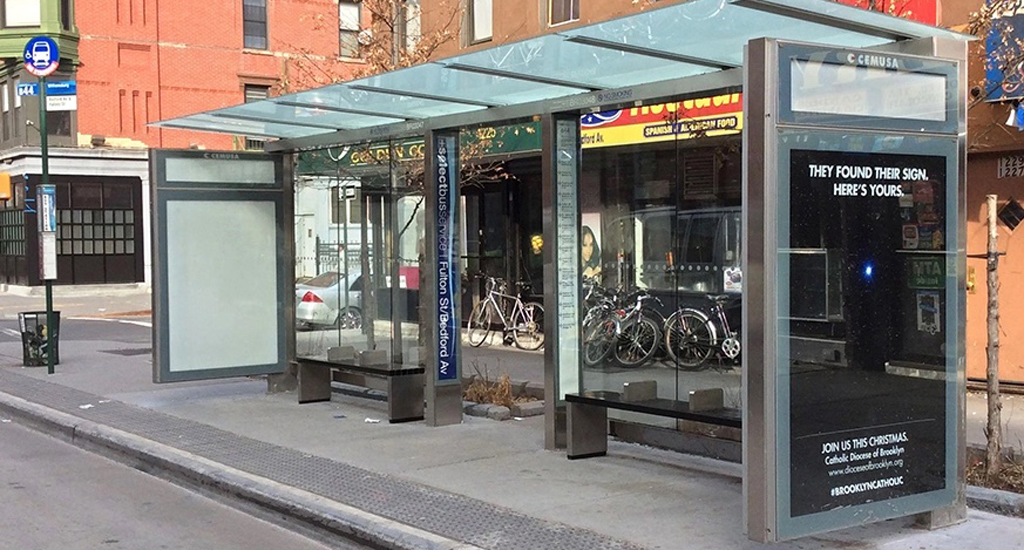
Friday’s Headlines: Gimme Bus Shelter Edition
The days of the Landmarks Preservation Commission reviewing every proposed bus shelter in landmarked districts may be no more. Plus more news.
Deal Reached: Hochul Says ‘Sammy’s Law’ Will Pass
The bill, though imperfect, has been four years in the making.
Komanoff: A ‘Noise Tax’ Can Ground NYC Helicopters
A proposed $400 “noise tax” on “nonessential” flights is a start — and it will work.