DOT Unveils Interactive Vision Zero Map, But NYPD Data Still Incomplete

As the Transportation Alternatives Vision Zero for Cities Symposium got underway in Downtown Brooklyn this morning, DOT released an interactive map of traffic crashes, street safety projects and more. One piece that's still missing, though: NYPD enforcement data.
"Vision Zero View" maps injury and fatal crashes based on the latest available data, updated monthly, and features information from prior years dating back to 2009. Users can sort crashes to see injuries or fatalities, and filter based on the victims' mode of travel (pedestrian, cyclist, motor vehicle occupant, or all of the above). The map includes a current count of known traffic injuries and fatalities.
Data is sortable by month and year, with summaries for each NYPD precinct, City Council district, and community board district. The "Street Design" tab has filters for displaying locations of leading pedestrian intervals, arterial and neighborhood slow zones, speed humps, Safe Streets for Seniors target areas, and "major safety projects."
For example, the map shows motorists have killed one pedestrian in Council Member Mark Treyger's district in 2014, and 133 pedestrians and cyclists and 236 motor vehicle occupants have suffered injuries there this year. There are no neighborhood Slow Zones in District 47, according to the map, and no major safety projects.
With the "Outreach and Education" tab, users can see where meetings, workshops, and other street safety related events are happening. Again, not much going on in Treyger's district.
Until recently, up-to-date geocoded crash information was not available to the public. With this map, crash data and other information related to Vision Zero are available in a unified, frequently-refreshed, user-friendly format. Chief of Transportation Thomas Chan said today that NYPD has put aside funding to upgrade its Traffic Accident Management System (TAMS), on which the Vision Zero map is based, and that the department is working on a system to geo-code traffic summonses. Hopefully those improvements will come.
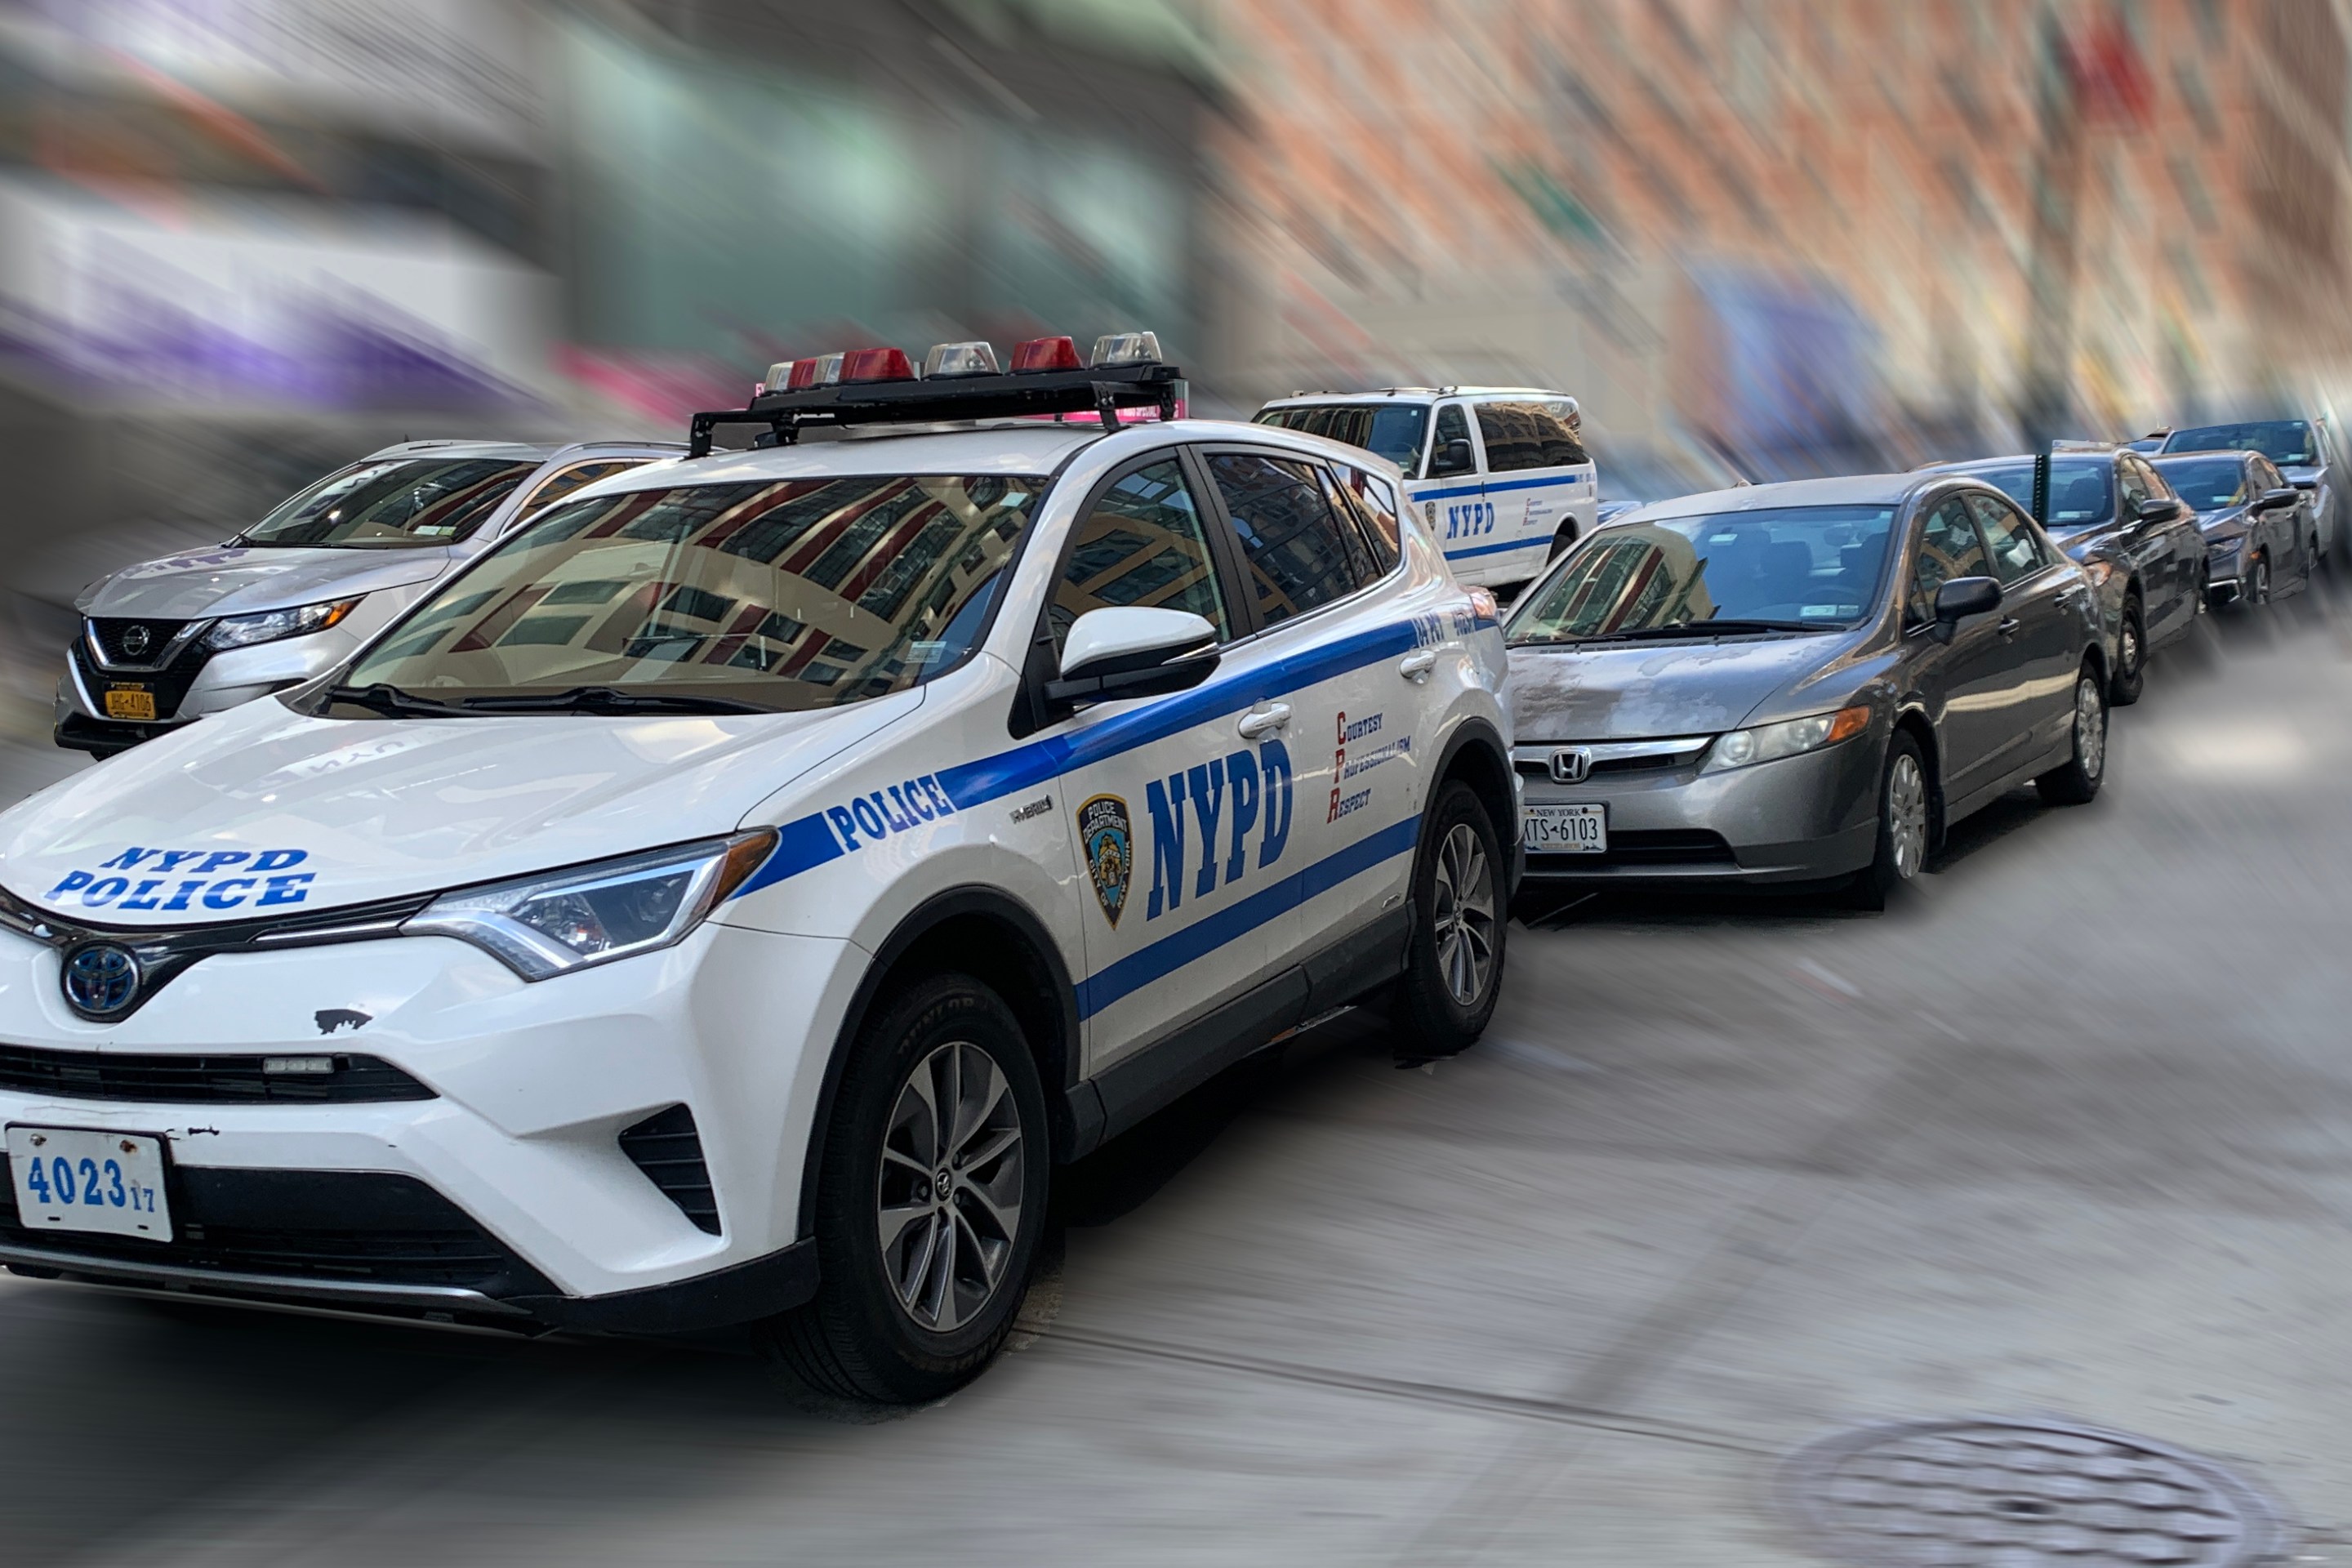
Software developers and safety advocates have long called for geo-coded traffic summons data, which would indicate where and whether police are enforcing traffic laws to make streets safer. Minus enforcement information, New Yorkers' Vision Zero view remains obscured.
Stay in touch
Sign up for our free newsletter
More from Streetsblog New York City
Tuesday’s Headlines: Valley of Political Death Edition
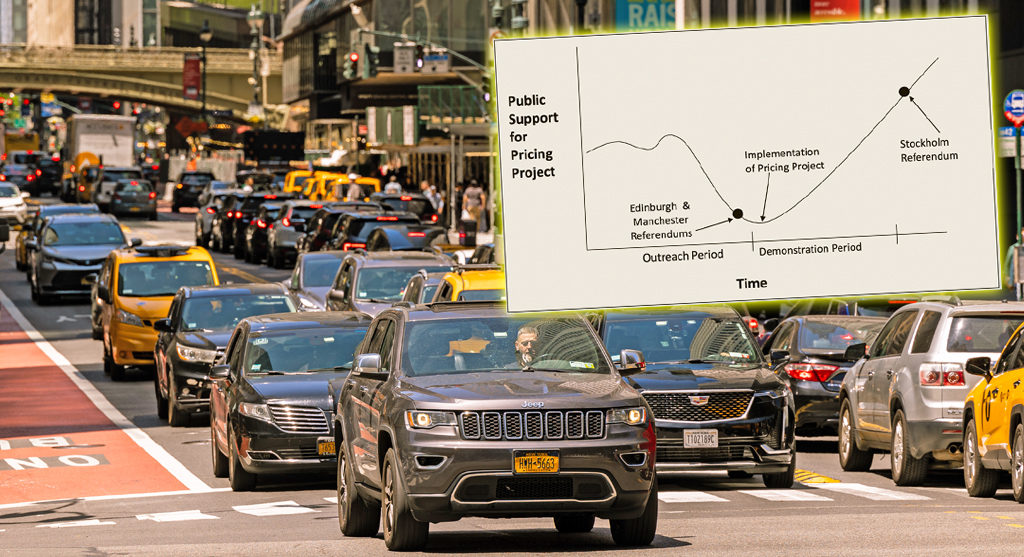
Did you see the new poll showing congestion pricing is really unpopular? Ignore it! Good times are coming. Plus other news in today's headlines.
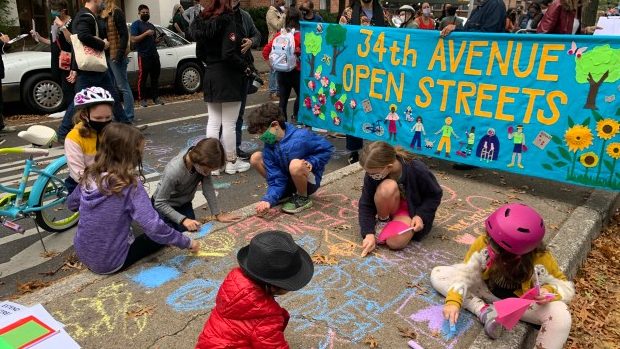
Open Streets Groups Warn of Extra Red Tape to Run Events
Two weeks notice for hopscotch or a yoga class?
Monday’s Headlines: A Federal Case over Parking Edition
We're flicking our bicycle bell over a big scoop last week that no one picked up on...yet. Plus other news.
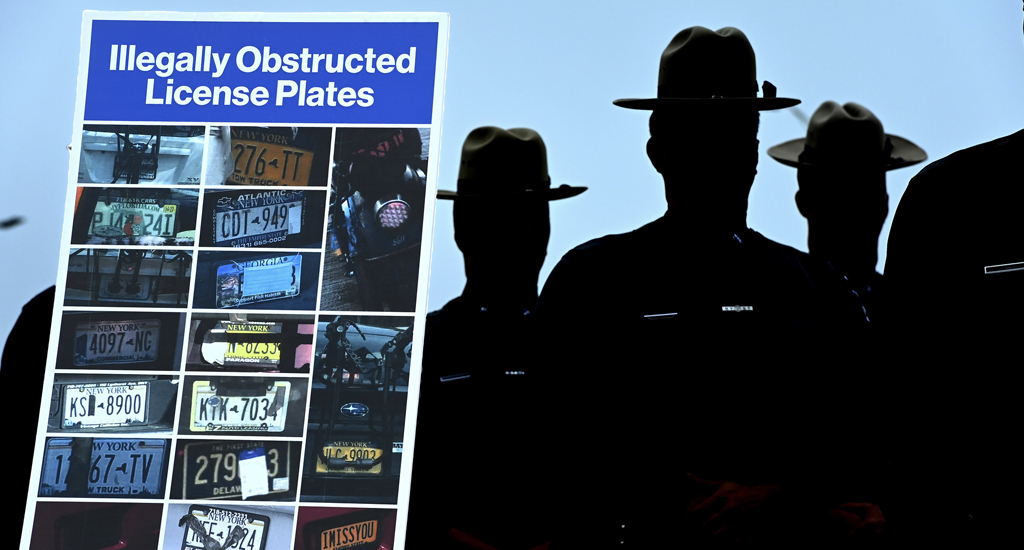
Hochul, Legislators Reach Toll Evasion Crackdown Deal
Higher fines for covering a plate and for not paying tolls are part of the budget deal inked on Saturday.
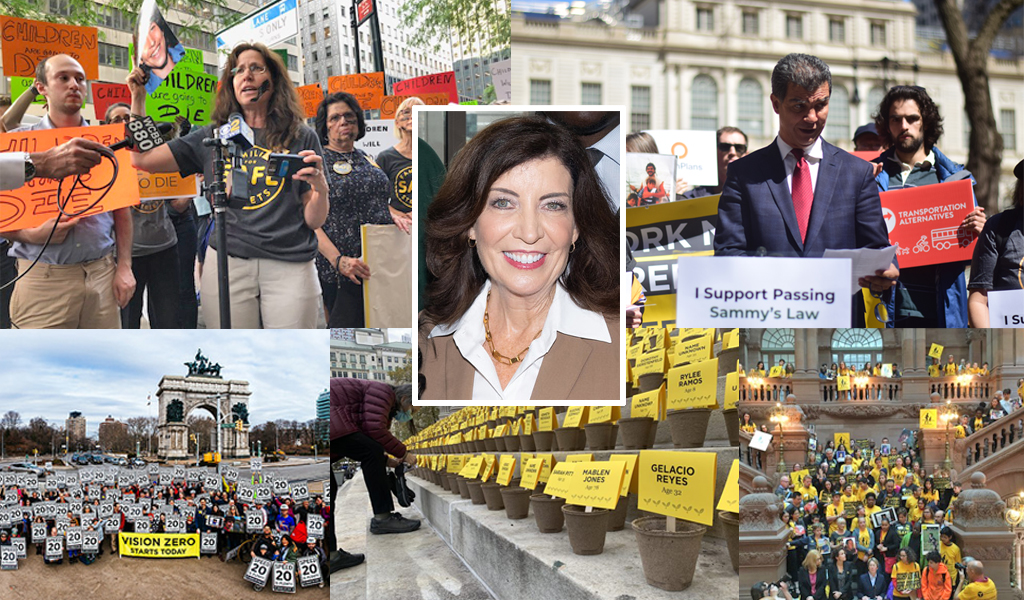
Behind the Scenes: How Gov. Hochul Got ‘Sammy’s Law’ Over the Finish Line
Opponents didn't want to put their name on a no vote for the life-saving measure.