A poll released by Transportation Alternatives today [PDF] sheds some new light on how NYC voters feel about street redesigns and automated enforcement when the policies are framed in terms of safety benefits.
Opinion polls by Marist, Quinnipiac, and the New York Times have consistently shown that New Yorkers support bike lanes by a large margin. The new poll that TA commissioned from firm Penn Schoen Berland is different in a few ways. It surveyed the subset of New Yorkers who are likely to vote, and on the question of bike infrastructure, it asked specifically how people feel about protected bike lanes in their neighborhood, given the improvements in safety that have been observed on NYC streets. The responses from 875 likely voters (polled via land lines and cell phones September 11-18) indicate broad support for this type of redesign when the safety benefits are front and center, and that running against bike lanes isn't a winning position for candidates seeking citywide office.
While the survey sample included a higher proportion of car owners (61 percent) than the city as a whole (46 percent), the poll still found a wide margin of support for speed cameras. Focusing on likely voters also skewed the pool to long-time residents -- 83 percent said they have lived in the city for at least 20 years -- and the survey yielded some intriguing information about their travel behaviors and experiences with traffic violence.
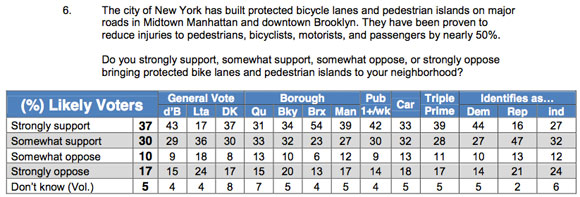
Two-thirds of respondents expressed support for protected bike lanes in their neighborhood after the pollsters read this question:
The city of New York has built protected bicycle lanes and pedestrian islands on major roads in Midtown Manhattan and downtown Brooklyn. They have been proven to reduce injuries to pedestrians, bicyclists, motorists, and passengers by nearly 50%.
Do you strongly support, somewhat support, somewhat oppose, or strongly oppose bringing protected bike lanes and pedestrian islands to your neighborhood?
Among New Yorkers who plan to vote for Joe Lhota, the spread was a smaller but still a sizable 53-42 in favor of protected bike lanes.
By a 9-to-1 margin, respondents supported speed cameras in school zones after hearing the following:
In 2012, more people were killed by traffic than murdered by guns in New York City. Speeding is the most common contributing factor in fatal crashes. New York City has recently installed speeding enforcement cameras in school zones. These cameras record cars that go 10 miles per hour or more through the school zone. Using the cameras, the city police issue speeding tickets with $50 fines.
Large majorities also favored expanding the number of active speed cams and the hours they're in operation. The state law enabling NYC to use automated speed enforcement limited the program to 20 cameras, effective only during hours when kids are expected to be around schools.
Nearly a third of respondents said they have been affected by traffic violence: 9 percent said they have been seriously injured in a traffic crash, and a further 24 percent said they know someone who has been seriously injured or killed.
In Queens, the Bronx, and Staten Island, big majorities pegged a specific street when asked to identify the most dangerous street in their borough -- an open-ended question. That's how bad it is on Queens Boulevard (73 percent of Queens respondents said it's the most dangerous), the Grand Concourse (56 percent of Bronx respondents, and Hylan Boulevard (75 percent of Staten Island respondents).
While the pool of respondents skewed toward car owners compared to the city's overall population, likely voters are still much more likely to rely on subways and buses for daily transportation needs than driving: The "primary way to get around" is transit for 54 percent of New York's likely voters (38 percent subway/16 percent bus), with 27 percent using primarily cars.
In terms of how often likely voters travel by different modes, 12 percent said they bike more than once a week -- a lower share than most other modes, but on par with the weekly frequency of taxi ridership (13 percent use taxis more than once a week), and more than you'd guess based on the limited data in Census commuter surveys.
