New Map Presents NYPD Crash Data as It Was Meant to Be Seen

There is a new mapping tool that presents NYPD crash data in a way that will be useful to advocates, electeds, and citizens who want to improve safety on neighborhood streets.
A bit of background. For years, NYPD guarded traffic crash data like a state secret. After the City Council forced the department to make the data available to the public, it was first released as a series of PDF files. This wasn't very helpful in targeting crash-prone locations for increased enforcement or design improvements, which, contrary to NYPD's fear that data would be manipulated to "make a point of some sort," is why electeds and advocates wanted the information published.
Enter freelance web developer John Krauss. Last year, Krauss began scraping crash data from the PDFs, with help from Transportation Alternatives and others, and posting it in multiple formats. Now he has translated the data into a multi-functional map that looks a lot like what street safety proponents were aiming to get from NYPD.
"When the NYPD first released the collision (née 'accident') data, I thought it was awesome and incredibly valuable," said Krauss, via email. "I've done heat maps and time-sliding maps before, but it was a fun challenge to load up and visualize over 30K intersections over a significant period of time. It took a few weeks of on-and-off again work."
NYC Crashmapper loads as a heat map, and reveals specific crash locations as you zoom in. Data is searchable by month, and can be filtered to show crashes, collisions with injuries, the number of people involved, and injury type per mode (pedestrian, cyclist, motorist, vehicle passenger). Krauss says more filters will be added, including fatalities for all collision types, vehicles involved, and contributing factors. With this map, anyone with access to an Internet connection can pinpoint where traffic crashes are happening in their neighborhood.
The map draws on data from Excel files, which NYPD started posting within the last year or so. "Although they're riddled with errors and appear to be copy-pasted from the PDFs somehow, they're still better," Krauss says. "I'm [also] publishing the raw clean, geocoded CSVs for anyone to use."
The map will update automatically each month, and will reflect historical data updates from NYPD. Updates will be tweeted @crashmapper.
NYC Crashmapper is a volunteer project for Krauss, who can be found most mornings riding his bike in Prospect Park. "I'm freelance," Krauss says, "ring me up."
Stay in touch
Sign up for our free newsletter
More from Streetsblog New York City
Wednesday’s Headlines: Four for Fifth Edition
The good news? There's a new operator for the Fifth Avenue open street. The bad news? It's four blocks, down from 15 last year. Plus other news.
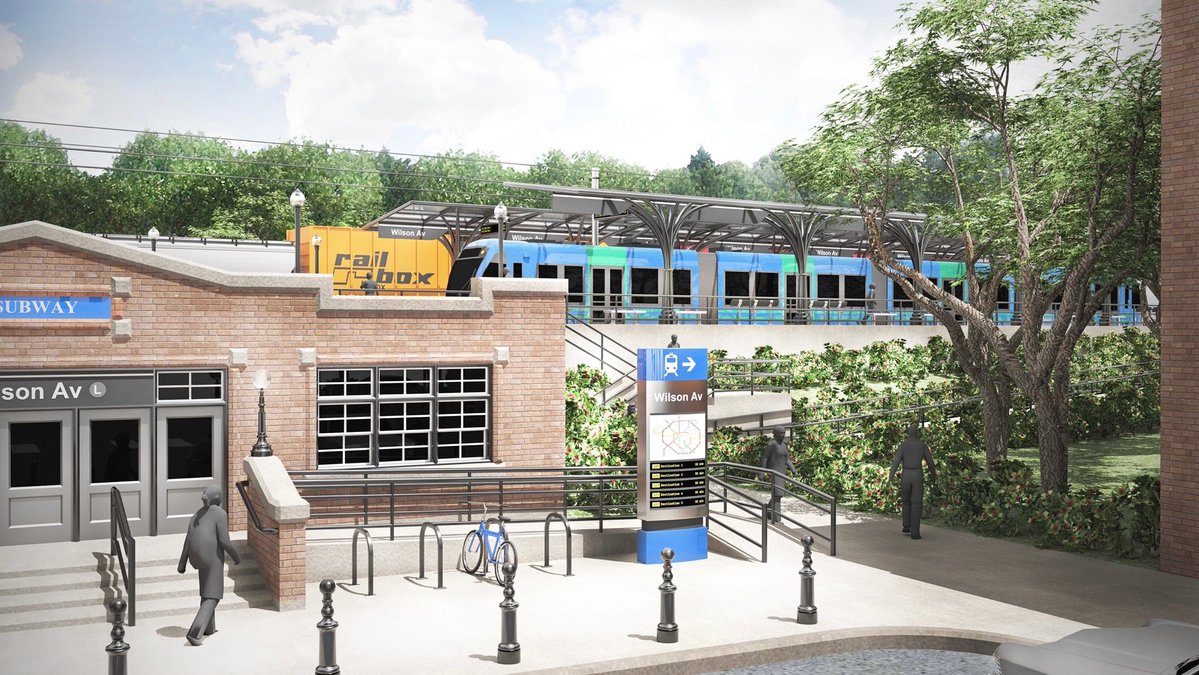
MTA Plan to Run Brooklyn-Queens Train on City Streets a ‘Grave’ Mistake: Advocates
A 515-foot tunnel beneath All Faiths Cemetery would slightly increase the cost of the project in exchange for "enormous" service benefits, a new report argues.
Full Court Press by Mayor for Congestion Pricing Foe Randy Mastro
Pay no attention to that lawyer behind the curtain fighting for New Jersey, the mayor's team said on Tuesday, channeling the Wizard of Oz.

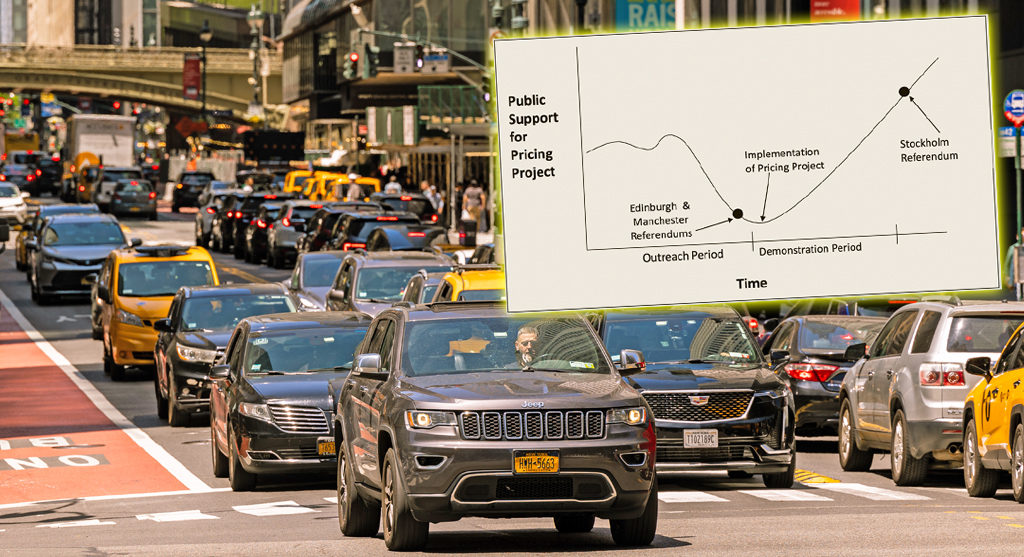
Tuesday’s Headlines: Valley of Political Death Edition
Did you see the new poll showing congestion pricing is really unpopular? Ignore it! Good times are coming. Plus other news in today's headlines.
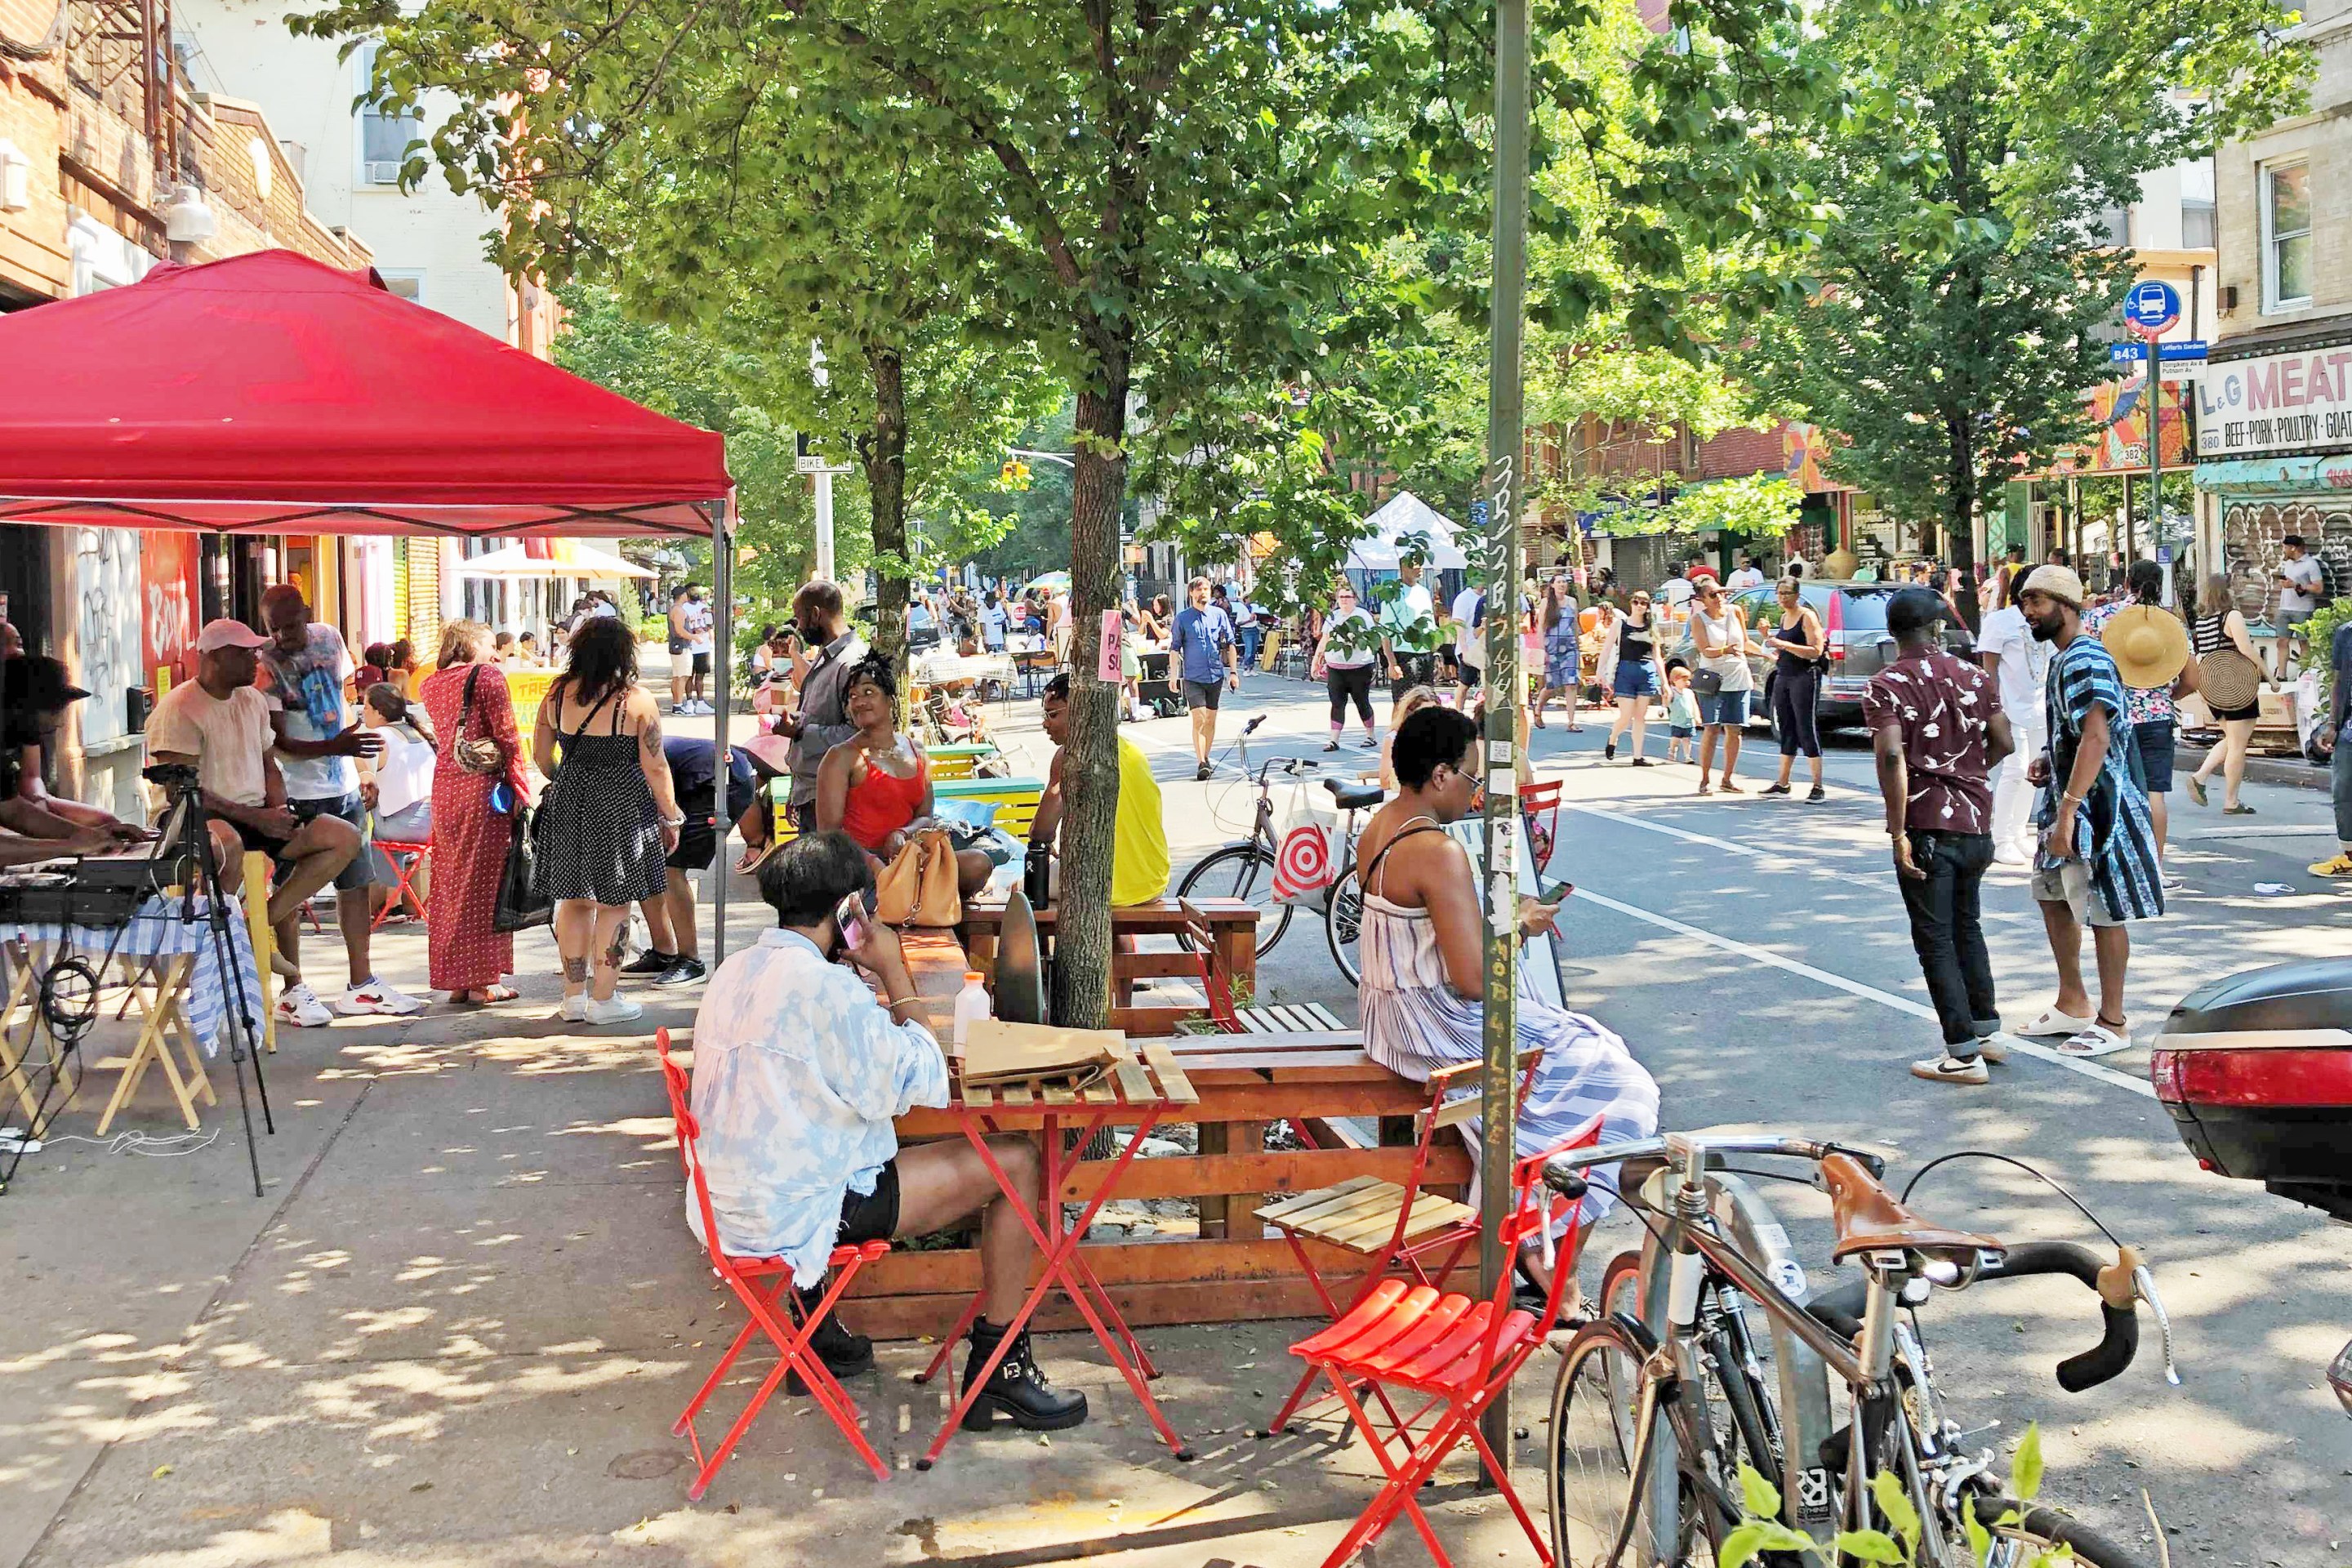
Open Streets Groups Warn of Extra Red Tape to Run Events
Two weeks notice for hopscotch or a yoga class?